
How to Annotate and Measure 3D Gaussian Splatting Scenes
Add markers, measurements, and areas to 3DGS scenes for review, documentation, and QA. A practical guide to the annotation toolset and export workflow.
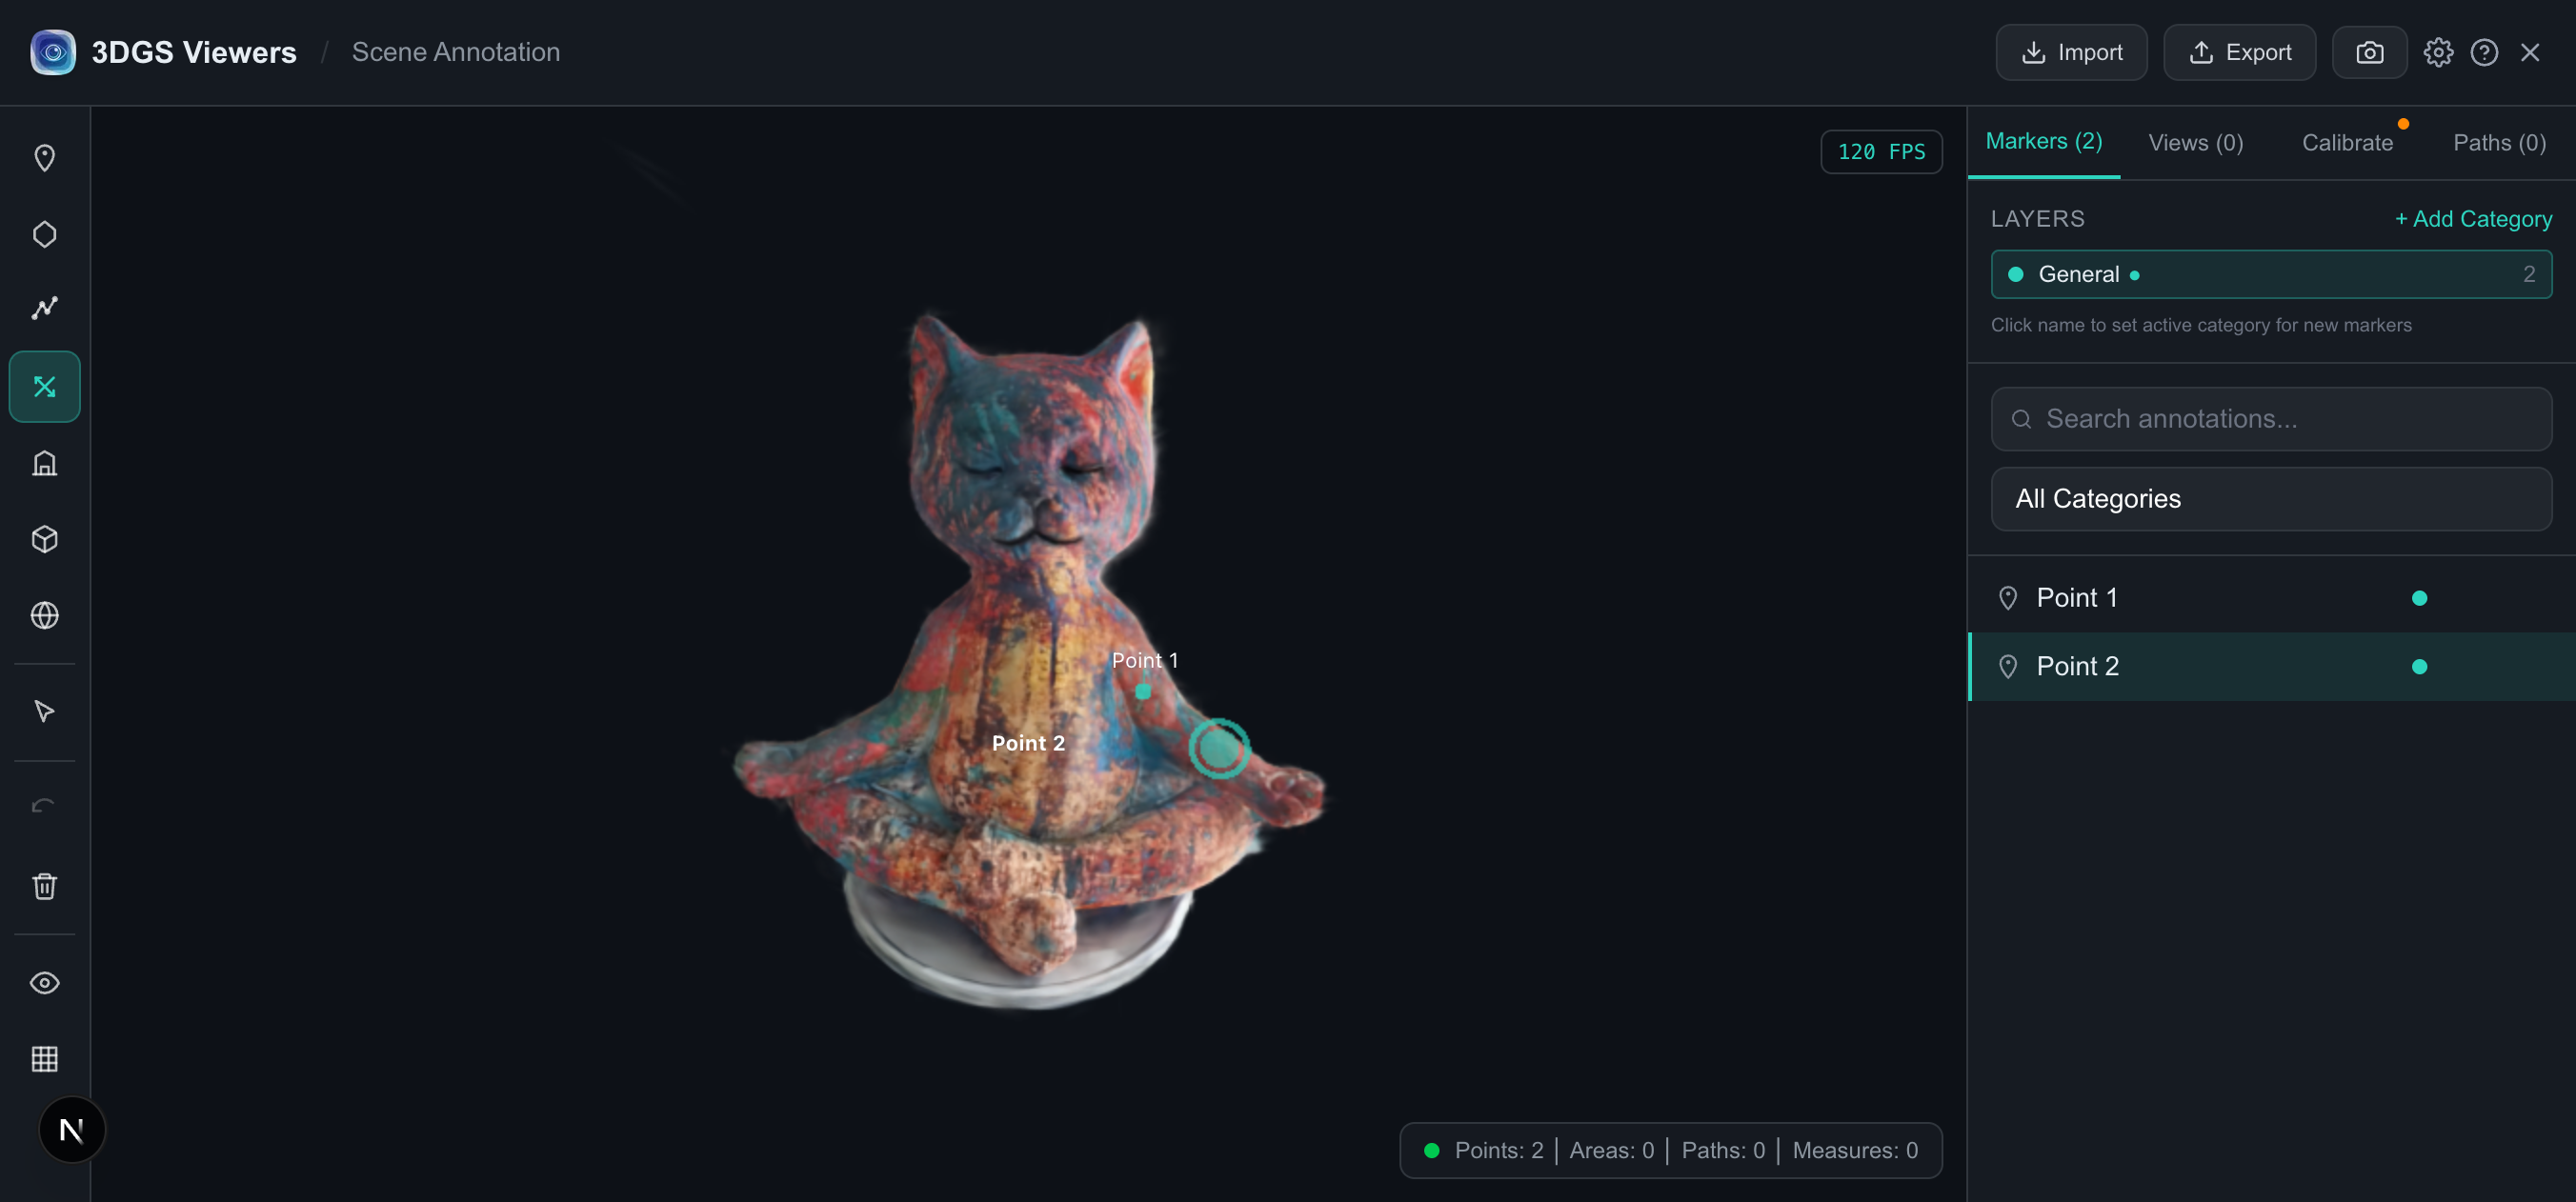
A 3D Gaussian Splatting model on its own is a rendering. To turn it into something you can review, document, or hand off, you need to mark it up: drop a marker on the spot where a client reported a defect, measure the distance between two features, circle a region for follow-up. That is what the Scene Annotation tool is for.
This is a practical guide to annotating and measuring 3DGS scenes in the browser — the marker types, the measurement workflow, the calibration step that makes measurements physically meaningful, and how to export the result.
The annotation toolset
The tool offers seven marker types, each placed by clicking on the model surface (placement uses raycasting, so markers snap to actual geometry rather than floating in empty space).
| Type | Shortcut | Use it for |
|---|---|---|
| Point | P | Single labeled markers — defects, points of interest, callouts |
| Area | G | Polygon regions — “this whole patch needs work” |
| Path | H | Polylines — routes, edges, sequences of points |
| Measurement | M | Two-point distance measurements with live readout |
| Plane | toolbar | Movable/rotatable planes (with TransformControls gizmo) |
| Box | toolbar | Axis-aligned bounding volumes |
| Sphere | toolbar | Radial regions of interest |
Placing markers
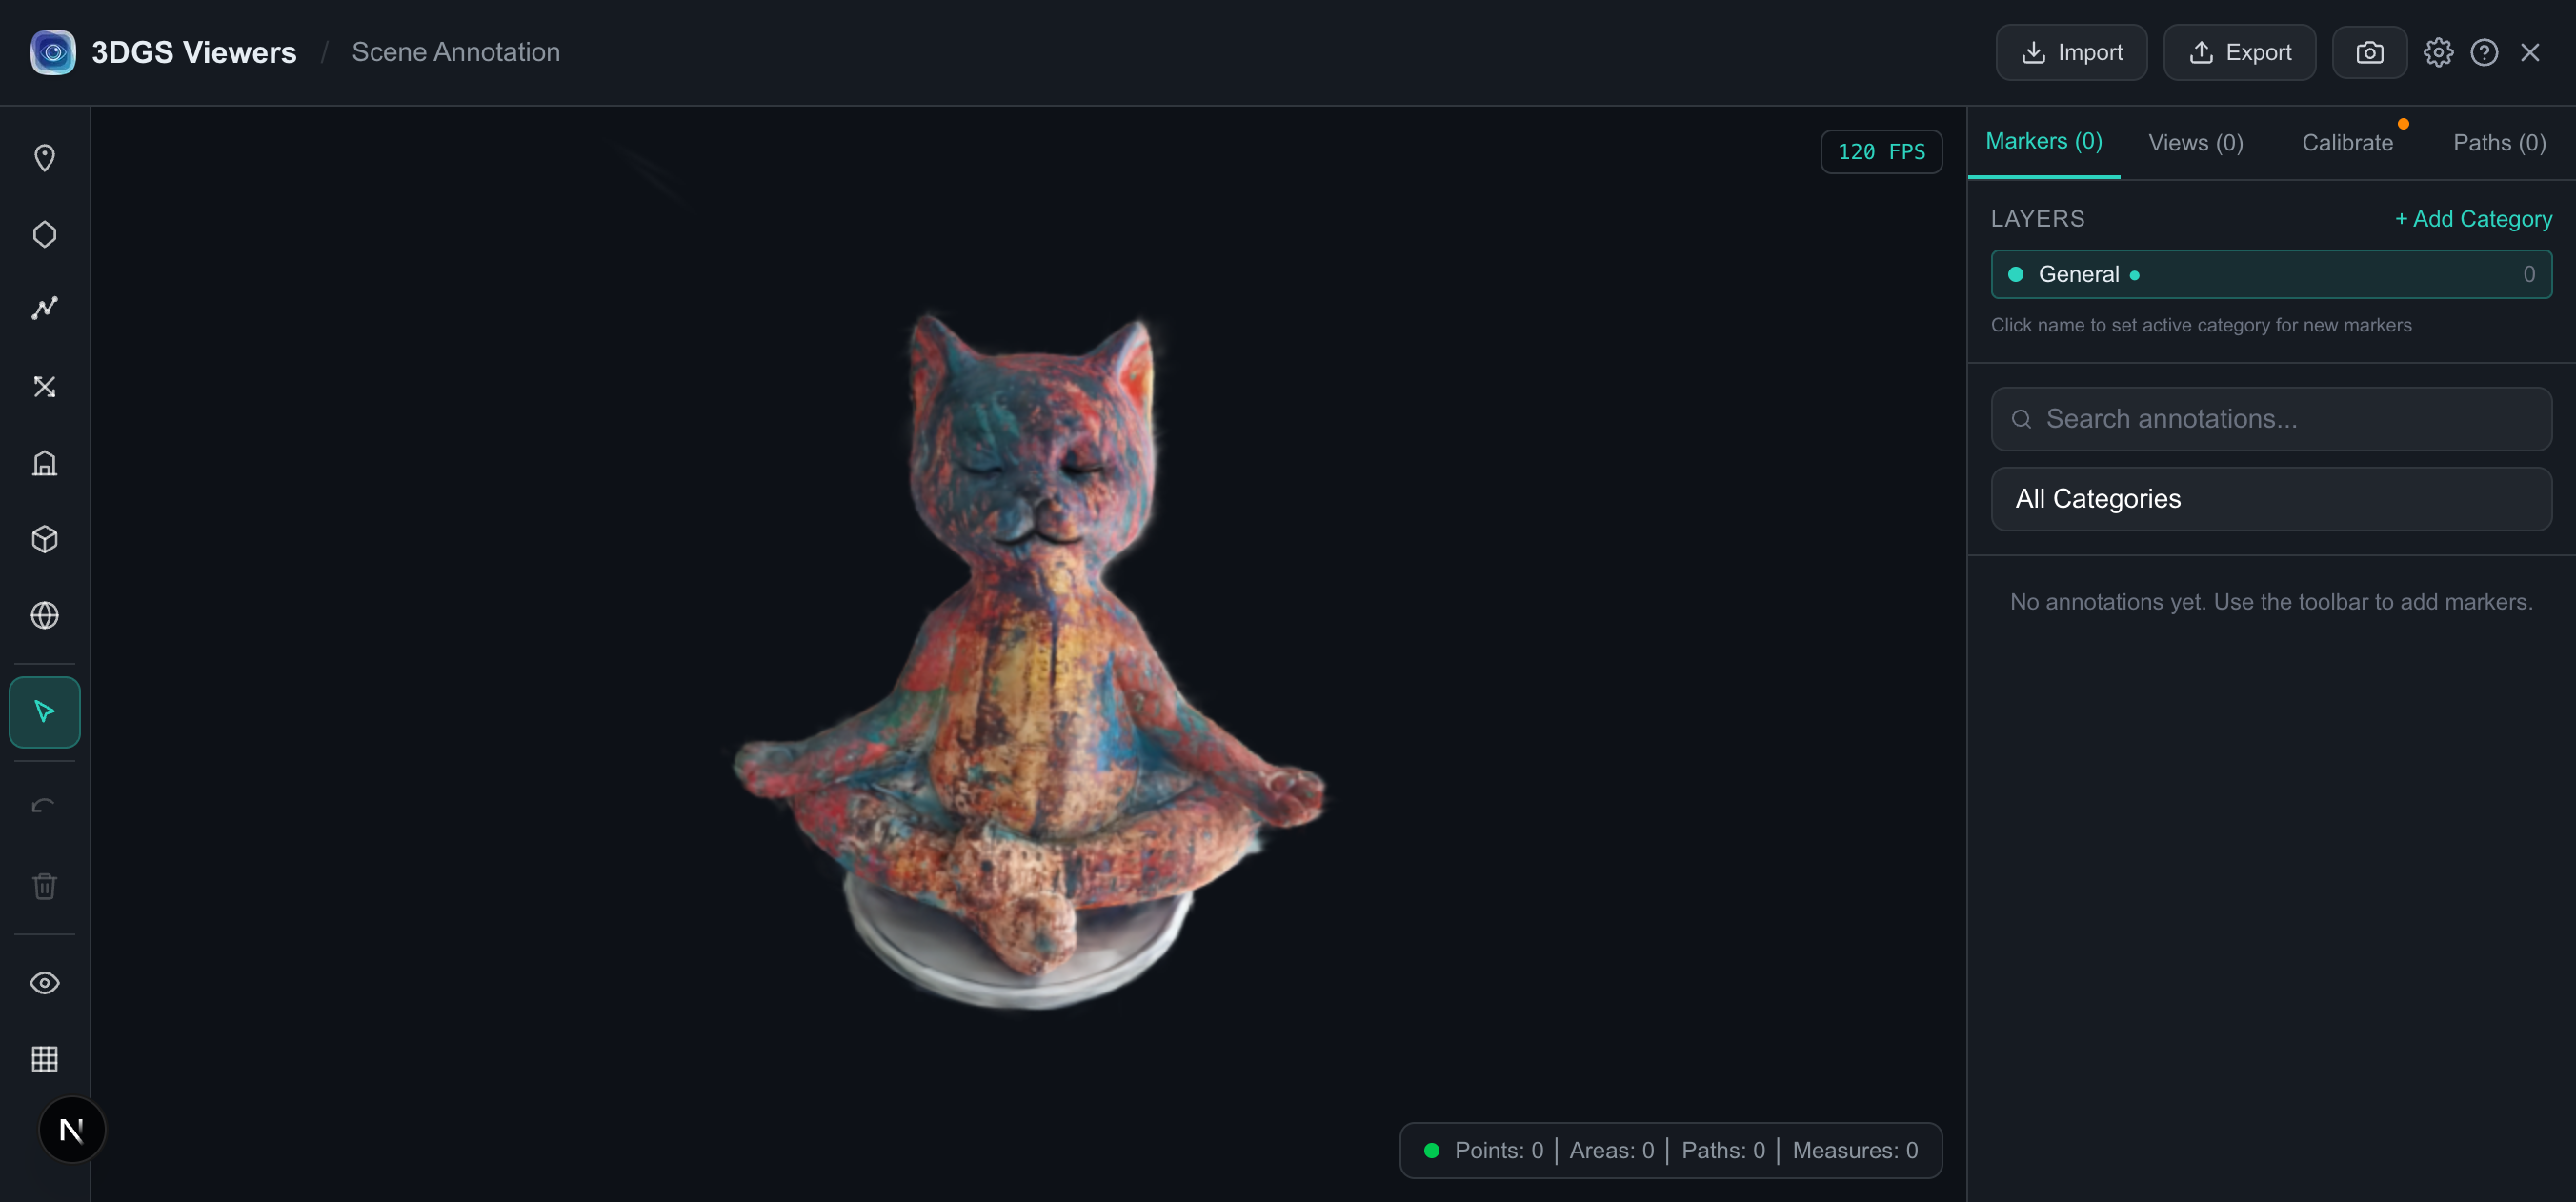
Select a tool (press P for points, M for measurements, and so on), then click on the model surface. Each marker is placed precisely where the ray from your click intersects the splat surface, so markers stay attached to geometry as you orbit.
Here is a scene with a couple of point markers placed:
Organizing with categories
Every marker belongs to a category(a layer). The tool starts with a default “General” category; click + Add Categoryto create more (“Defects”, “Client review”, “Measurements”, whatever fits your workflow). The active category is where new markers land, so you can switch context by clicking a category name. Categories double as a filter in the annotations list.
Measuring distances
Select the Measurement tool (M), click the start point on the surface, click the end point, and press Enter to complete. The tool reports the Euclidean distance between the two points in scene units.
By default, distance readouts are in whatever unit the source model's coordinate system uses — often meters if the capture came from a metric SLAM/photogrammetry pipeline, but arbitrary otherwise. To make measurements meaningful (real-world meters, feet, etc.), use the Calibrate panel to set a known reference distance or a scale factor. After calibration, all measurements and the gizmos for planes/boxes reflect the chosen unit.
Calibration options
The Calibrate panel exposes several ways to tie the scene to real-world units:
- Scale — a single multiplier if you know the model is off by a fixed factor.
- Reference distance — measure a known real-world length in the scene (a doorway, a standard object) and tell the tool what it should be.
- Ground height & north — orient the scene so up is up and forward is north, useful for site documentation.
- Geo reference — pin the scene to geographic coordinates for site work.
- Transform matrix — for full programmatic control when integrating with another pipeline.
Calibration also affects camera paths and the bounding-box gizmos, so it is worth setting up once at the start of an annotation session.
Saving and exporting
Annotations persist in your browser's localStorageautomatically — reload the page and your work is still there. For sharing, archiving, or moving to another machine, use Export, which downloads a structured JSON file containing:
- All annotations (points, areas, paths, measurements, planes, boxes, spheres) with their coordinates and metadata
- Categories and layer assignments
- Saved viewpoints (camera positions with thumbnails)
- Camera paths (for fly-throughs — see the next article)
- Calibration settings (scale, orientation, geo reference)
The companion Import button loads a previously exported JSON, so you can move an annotation session between browsers or hand it to a colleague.
You can also export a screenshot of the current view with all visible markers rendered, which is often the fastest way to share a single annotated frame in a report or message.
Annotations are stored locally and exported as files, not synced to a cloud account. That means your data stays private and the tool works offline, but it also means you need to export to move sessions between devices. If you want a shareable link with annotations baked in, export the JSON and pair it with a hosted model on the receiving end.
Saved viewpoints
The Viewspanel lets you capture the current camera position as a named viewpoint, with an auto-generated thumbnail. This is how you build a review tour: set up the view you want a reviewer to see, save it, give it a name (“Entry defect”, “North facade”), and move on. Clicking a saved viewpoint jumps the camera back to that exact position. Viewpoints export as part of the JSON, so a reviewer re-loading your file can step through them in order.
Useful keyboard shortcuts
| Key | Action |
|---|---|
V | Navigate / Select mode (default) |
P | Point marker tool |
G | Area (polygon) tool |
H | Path (polyline) tool |
M | Measurement tool |
Enter | Complete the current drawing (polygon, path, measurement) |
F | Fit all markers in view |
L | Toggle label visibility |
1 / 2 / 3 | Translate / rotate / scale gizmo (for planes, boxes, spheres) |
4–9 | Snap to axis-aligned views (front, back, left, right, top, bottom) |
A typical annotation session
- Load the model in the annotation tool.
- Open Calibrate and set scale using a known reference (optional but recommended for measurements).
- Create categories for the kinds of annotations you'll make (e.g. “Defects”, “Measurements”).
- Drop markers, draw areas, take measurements. Switch active category as you go.
- Save viewpoints for the camera positions you want a reviewer to see.
- Export JSON (for the full session) and/or a screenshot (for a single frame).
Further reading
- Planning camera paths for fly-throughs — turn your annotated scene into an animation.
- Comparing 3DGS training runs — another review workflow, for quality rather than documentation.
- Full annotation guide and FAQ — every marker type and shortcut in detail.
Try it in your browser
3DGS Viewer runs entirely in your browser — no installation, no upload required for the tools covered in this article. Pick a tool and start in seconds.